The Network Diagnostics Tool#
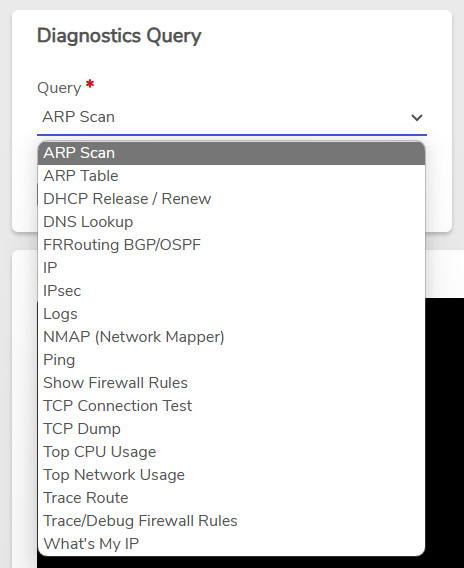
The built-in Diagnostics query engine allows quick and easy access to extended network information, such as DNS queries, traceroute, ping, arp, TPC Dump, BGP Quagga. The Diagnostics Tool is available for each network.
To Access Network Diagnostics:#
- Navigate to the desired Network Dashboard.
- Click Diagnostics on the left menu.
- The Query list dropdown provides a comprehensive set of available diagnostic queries. (See the bottom of this page for a list of each query option, along with a brief description.)
Depending on the query selected, there may be additional fields that can be specified on the right. For example, the screenshot below shows a TCP Dump query selected; there are several values that can be specified for this query.
Many query fields will auto-populate with default values that are suitable for common queries. {.is-success}
Diagnostic Query List#
Some query options are only intended for very advanced, low-level troubleshooting. Contact Verge.io Support for additional assistance. {.is-info}
-
ARP Table#
Standard ARP cache
-
ARP Scan#
Standard ARP scan tool used to discover all active devices in an IPV4 range. Caution should be used as an ARP scan has the potential to be disruptive to a network.
-
DHCP Release/Renew#
For networks implemented as dhcp client (such as edge installations). Forces a release/renew of the assigned dhcp lease. Release/renew is sometimes necessary after network reconfiguration, power outages, etc.
-
DNS Lookup#
Test DNS functionality from your network, searching specific host names/query types.
-
Show Firewall Rules#
NFT format (low-level) translation of network firewall rules. Typically, viewing firewall configuration through the Verge.io UI (Rules) will be adequate. This query is made available for advanced firewall troubleshooting.
-
IP#
Standard Linux IP command provided for advanced troubleshooting of interfaces, routing, etc. Documentation for this command can be found at: https://linux.die.net/man/8/ip
-
IP Sec#
Standard set of IP Sec sub commands that can be used to control and monitor IPsec connections and the IKE daemon.
-
Logs#
Display network’s container log
-
NMAP#
Discovers devices and maps out the network.
-
Ping#
Standard Ping command
-
FRRouting BGP/OSPF#
A comprehensive set of commands that can be used to diagnose BGP/OSPF installations. More information on FRR commands can be found at: https://docs.frrouting.org/en/latest/basic.html
-
TCP Connection Test#
Used to test establishing a tcp connection over a specific port. For example, it can be utilized to verify a standard ssh connection is possible by running the query with port 22 specified.
The Host value can be modified to test connection to a different address.
-
TCP Dump#
Standard TCP Dump (packet sniffer)
-
Top CPU Usage#
Top CPU-using processes within the network’s container.
-
Top Network Usage#
Although Information about a network’s top net usage (e.g. Virtual Machines) can be viewed easily on the network’s dashboard, this query can provide more detailed information including IP address and destination. This can be helpful to track a network that might be flooded from an external source.
-
Trace Route#
Standard Trace route functionality; provides detail about the routers and hop counts from the given network to a destination address.
-
What’s my IP#
Returns the current IP address that this network is using to get out to the Internet.
Network Interface Names#
These are the interfaces that you may see in a network container.
-
eth0#
This is the router interface for the network - This always exists.
-
eth1#
This is the DMZ interface that will be used for network-to-network traffic - This always exists.
-
eth2+#
Additional routing interfaces may exist in BGP networks.
-
wg*#
Any interface with this prefix is a WireGuard interface.
-
lo#
Loopback interface.
