Navigating the VergeOS User Interface#
This page provides general information about the VergeOS User Interface (UI). Detailed information about performing specific actions in the software can be found in the content sections of the Help.
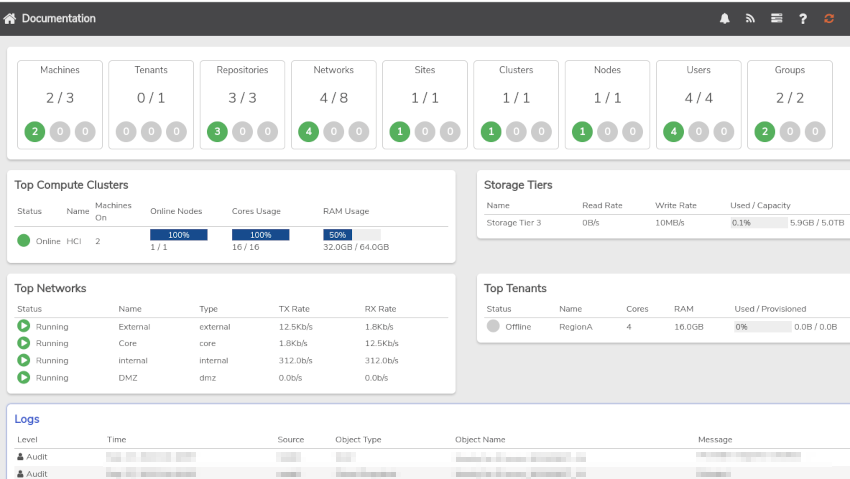
The Main Dashboard#
The home screen of the VergeOS UI is the Main Dashboard for your VergeOS Cloud. It provides overall system information, including:
- Top-level, statistical information for the VergeOS Cloud
- Main system logs
- Left Navigation menu to access subsections of the application
- Quick links within the Dashboard section to drill down to subsections
Dark Mode#
By selecting the User Menu in the upper-right, you can enable Dark Mode. This may also affect customized colors from custom branding.
Breadcrumbs#
Breadcrumbs are links at the top of the screen that reflect the recent history of selected sections; each breadcrumb provides quick access back to a recent screen.

The first breadcrumb (a home icon, labeled with the system name) will always provide a quick link back to the Main Dashboard.
Note
Clicking the Home breadcrumb will also clear all other breadcrumbs.
More Dashboards#
Dashboards, providing at-a-glance information (and quick-link access to more detailed information), are available throughout the system. Subsections, such as networks, machines, and storage each have one. Specific instances of objects also have their own dashboard as well, such as each individual: VM, network, node, tenant, etc. Every dashboard contains many links that can be used to dive further into more detailed information.
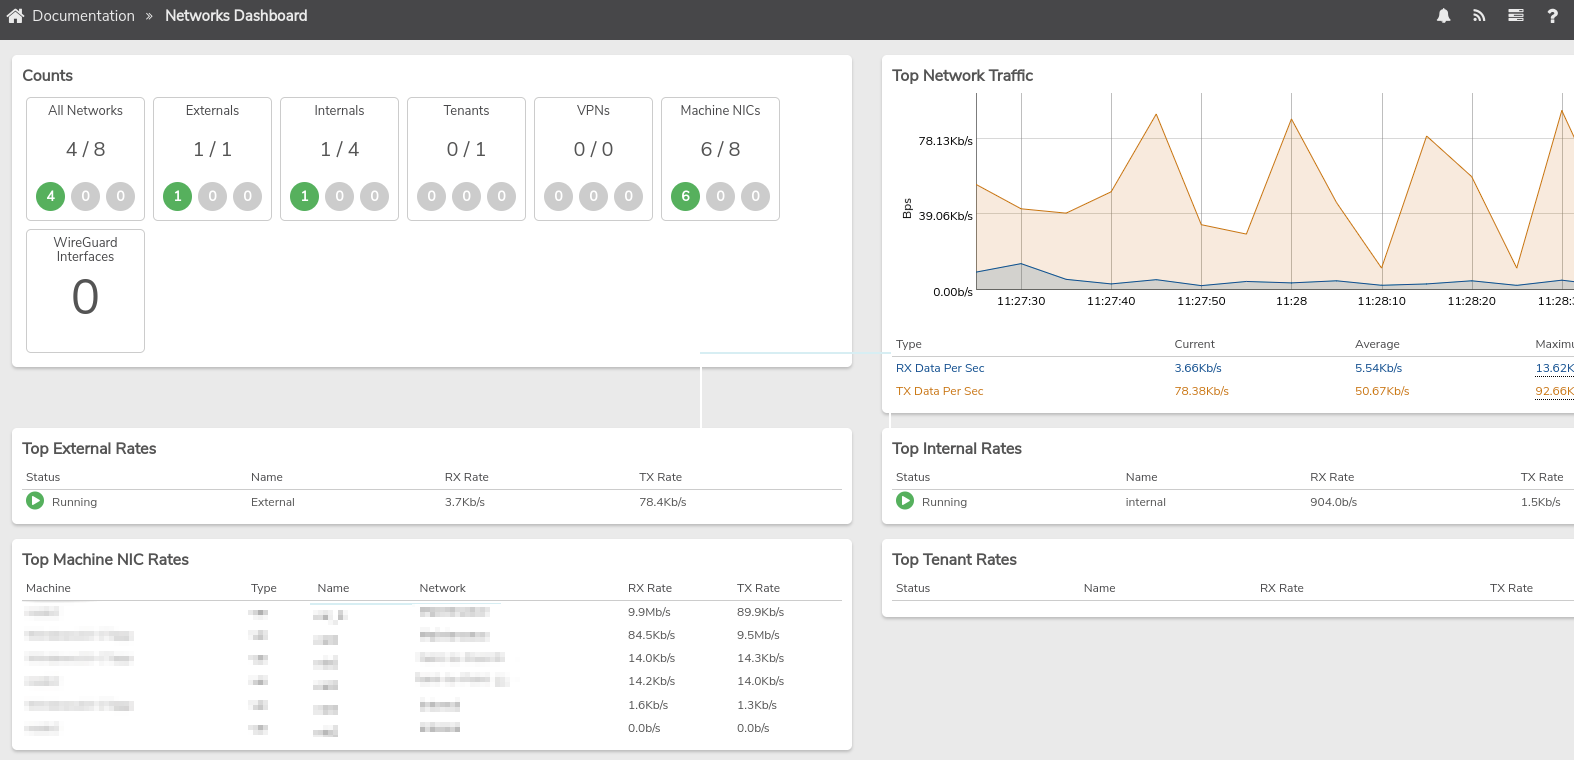
Example 1: Networks Dashboard#
The Networks Dashboard provides overall network statistics, network-related logs, and links to drill down into more detailed information per network, network device, etc.
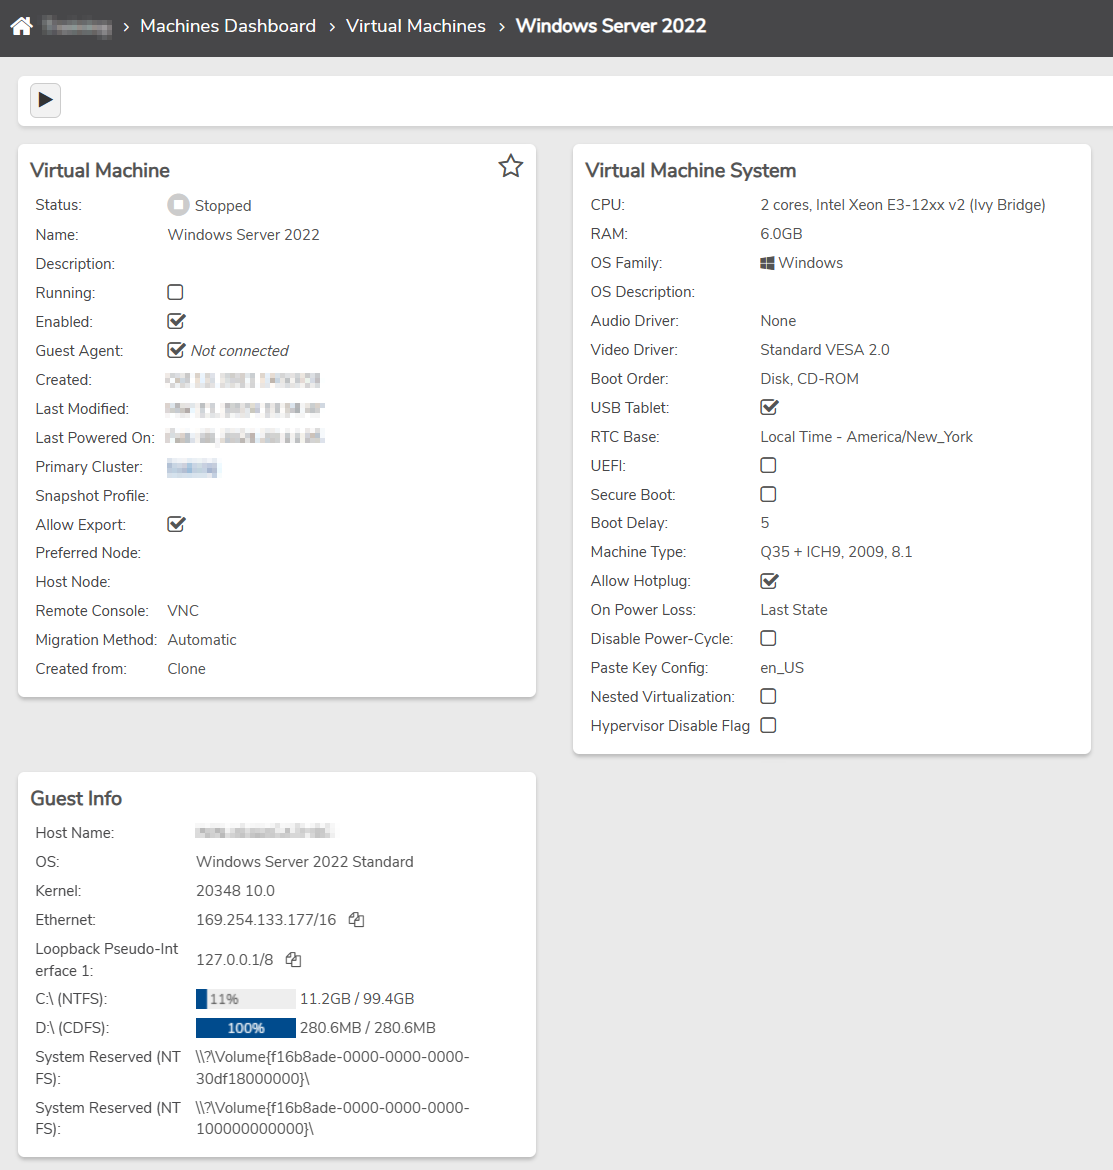
Example 2: VM Dashboard#
There is a dashboard available for each individual virtual machine. The dashboard for a VM will show important information for the specific instance. Links on the VM dashboard allow for accessing detailed information regarding its drives, NICS, snapshots, devices, host node, etc.