Skip to content

vSAN#

Scaling Up a vSAN

Standard Operating Procedure Required

Please review the complete vSAN Scale Up SOP for comprehensive preparation, execution, and verification procedures.

To scale up a vSAN, follow the steps below. However, before proceeding, ensure that your current vSAN has at least 30% free capacity.

Important

  • All drives in a tier must be alike. If a drive of an incorrect size is added to an existing tier, the tier will only be able to use the space of the smallest drive.
  • Ensure that your vSAN has at least 30% free capacity unless you are doubling the capacity. If the free space is less than 30% and you are not doubling the drive count, consider scaling out by adding a node or opening up a support ticket for assistance.

Related Documentation

Required Reading: The vSAN Scale Up Standard Operating Procedure contains essential preparation, verification, and troubleshooting steps that must be completed before and after this scale up process.

Steps to Scale Up

  1. Physically add the drives or Fiber Channel LUNs on the node you want to scale up.

  2. Log in to the host system's UI and select the appropriate cluster you want to scale up from the top compute cluster section on the home page.

  3. Select the node that you are scaling up.

  4. Refresh the system to recognize the new drives: - Select Refresh from the left menu, and choose Drives & NICs from the dropdown. - Confirm by selecting Yes.

  5. Select the Scale Up option on the left menu.

  6. The page will now show the newly inserted drives in an offline state. Select the drive(s), then under Node Drives, select the Scale Up function.

  7. Select the appropriate tier for the drive(s) and submit.

Upon completion, the screen will refresh and the drives will disappear from the view. Go back to the main page, where you will see the vSAN tiers change color to yellow, indicating that it is in a repair state. This is expected, and the vSAN will return to a green/healthy state after a few minutes, showing the newly added tier or increased space on an existing tier.

Repeat these steps for each node as necessary.


Document Information

  • Last Updated: 2025-07-27
  • VergeOS Version: 4.13

vSAN Tier Status (Journal Walks)

Overview

This page is designed to help you understand VergeFS status metrics provided on the vSAN Tier Dashboard. These metrics provide insight related to Journal Walks, the processes that continually monitor and support vSAN data integrity.

Monitoring vSAN tier status information covered on this page is typically unnecessary during normal operation (general vSAN health and activity can be monitored on the Main Dashboard). The following details are intended for troubleshooting or for users interested in viewing Journal Walk activity specifics. This dashboard is most useful when investigating an issue or tracking the progress of a Journal Walk, such as during an update process.

Journal Walks

VergeFS employs a process called Journal Walks (also referred to as "Walks") to continually verify storage fidelity and safeguard against risks like hardware failures, silent bitrot, power disruptions, and misleading device write confirmations. These walks are automatically triggered, scanning each node to verify possession of its expected data blocks. In the event of any missing data blocks, which may result from: device issues, planned node reboots, or environmental disruptions, VergeFS proactively performs repairs to restore consistency.

Journal Walks operate as a background process; system operations proceed normally while a Journal Walk is in progress.

The system executes three types of Journal Walks:

  • Partial (differential) Walk - targets data changed since last walk transaction for quicker validation
  • Full Walk - scans all data across all nodes
  • Mixed Walk - occurs when a non-controller node reboots; only that node is fully scanned, while other nodes are differentially scanned.

Accessing vSAN Tier Status Information

Navigate to: Main Dashboard > vSAN Tiers > double-click the desired tier. This displays the dashboard for the selected vSAN tier. Refer to the Status tile on this page.

Status Data

  • Redundant: (checkbox) Reflects whether the vSAN tier is currently verified as redundant. If unchecked, maintenance mode will be disabled to prevent disruption. The box may appear unchecked during a full Journal Walk until redundancy is confirmed. It also remains unchecked if redundancy cannot be verified, such as when a node is offline after the Journal Walk completes.

  • Encrypted: (checkbox) Shows whether data in the vSAN tier is encrypted. Encryption status is set during installation and remains fixed; this setting cannot be modified after deployment.

  • Working: (checkbox) Indicates that a Journal Walk is actively running for this tier. If no snapshots or data changes are occurring, walks may complete too quickly to register as “working” in the UI.

  • Full Walk: (checkbox) Flags whether a full Journal Walk is in progress. Full walks are triggered by events such as controller startup or topology changes (e.g., node offline or added, drive failure, etc.).

When a node other than the active controller reboots, a Mixed Walk is triggered instead.

  • Walk Progress: Displays the current Journal Walk’s progress as a percentage, or shows “Idle” if no walk is active.

  • Last Walk Time (ms): Duration in milliseconds of the most recent Journal Walk.

  • Last Full Walk Time (ms): Duration in milliseconds of the most recent Full Journal Walk.

  • Current Transaction: A unique ID representing the latest transaction. This value increments with each Journal Walk, whether full, mixed, or differential.

  • Transaction Start Time: Timestamp indicating when the current or most recent Journal Walk began. Useful for diagnosing prolonged or stalled operations. (see Journal Walk Duration below).

  • Repairs: Displays the current count of missing data blocks detected on the tier. It’s normal to see a non-zero value after events such as node failures, maintenance operations, or updates. VergeFS Journal Walks automatically identify and work to correct these detected blocks using redundant data stored on other nodes. If redundancy fails (e.g. double node failure), the system will try to retrieve blocks from a configured repair server. Persistent repair counts (i.e. after several transaction increments) may indicate manual resolution is needed, and contacting VergeIO Support is recommended in such cases.

If missing data blocks have already been detected and a repair server isn’t yet configured, it’s not too late. Setting up a repair server now allows VergeFS to automatically attempt recovery of those blocks during subsequent Journal Walks.

  • Bad Drives: Indicates the number of drives missing since the current Journal Walk began. It’s common to see a non-zero value here after node reboots, maintenance, or updates; this doesn’t automatically signal a drive failure. Missing drives are typically related to offline nodes or detection delays at walk start. If no nodes are offline and this field shows a count, review drive and node status via the Main Dashboard for further insight.

Journal Walk Duration

Walk timespans are variable, with several factors that can affect durations, including:

  • Use of NVME Tier 0 for metadata
  • Available memory on controller nodes
  • Quantity of data on the tier
  • Amount of data changes since the last transaction

Walk Time Considerations

  • Updates involve full walks and mixed walks, hence the time it takes for these operations will affect necessary maintenance windows.
  • The time it ultimately takes to make large deletions and data tier migrations (e.g. from one tier to another) will be reliant on differential walk times.
  • Systems that follow published sizing and design recommendations should experience acceptable walk durations. For example, walks triggered during update operations generally fit within standard maintenance windows.

Walk Time Optimization

Walk times depend on the tier size and rate of data change. Adequate resources and proper network design significantly impact walk performance.

Tips to Optimize Journal Walk Times
  • Follow recommended Node Sizing Requirements (e.g. dedicated tier 0 using NVME drives, right-sizing controller memory for your environment)
  • Implement Network Design recommendations (e.g. adequate internode bandwidth of at least 10Gb, isolated, dedicated core networks)
  • Avoid overprovisioning workload RAM on compute-and-storage (HCI) nodes.
  • When possible, schedule maintenance operations that trigger Full or Mixed Walks during scheduled maintenance windows, while avoiding concurrent heavy I/O operations.

If you have questions or concerns about the timeframe of walk transactions, please contact our support team for assistance.
Adding Tier 0 to an Existing System

Overview

Key Points

  • Tier 0 is normally configured during initial installation
  • This procedure is for special cases requiring post-installation configuration
  • Requires careful attention to device paths and hardware compatibility

This guide outlines the process for adding Tier 0 storage to an existing VergeOS system. While Tier 0 is typically configured during installation, these steps provide a method for adding it to production systems that cannot be reinstalled.

Critical Warning

  • This procedure should only be performed by qualified VergeOS engineers or under direct support guidance
  • Selected devices will be formatted and all existing data will be destroyed
  • Incorrect device path selection can seriously damage your system

Prerequisites

Before beginning this procedure, ensure:

  • Storage devices are physically installed in the system
  • Tier 0 devices are consistent across controller nodes
  • Hardware meets specifications from the Node Sizing Guide

Steps

1. Identify Device Paths

  1. Navigate to System > vSAN Diagnostics from the Main Dashboard
  2. Select Get Node Device List from the Query dropdown
  3. Click Send
  4. Identify unused devices (marked as "vsan = false")
  5. Note the device paths (/dev/sd*) for each controller node

Tip

Verify current vSAN drive assignments by checking vSAN Tiers > [select tier] > Drives to avoid selecting drives already in use.

2. Add Drives to Tier 0

For each drive:

  1. In vSAN Diagnostics:
    • Set Query to Add Drive to vSAN
    • Select the appropriate Node (node0 or node1)
    • Enter the correct Path for the device
    • Set Tier to Tier 0
    • Configure Swap setting

Swap Configuration

  • Enable swap on only ONE storage tier
  • If swap is enabled on another tier, disable it for Tier 0
  • Contact VergeOS Support for guidance on swap configuration if needed
  1. Enter the verification phrase: Yes I know what I'm doing
  2. Click Send to execute

3. Verify Configuration

  1. Monitor the system dashboard for tier status - Status will show "online-no redundancy" during meta migration
  2. Refresh node information: - Navigate to each controller node's dashboard - Select Refresh > Drives & NICs

Post-Configuration

Monitor the vSAN tier status in the system dashboard. The tier should transition from "online-no redundancy" to "online" once meta migration completes.

Additional Resources


Document Information

  • Last Updated: 2024-11-25
  • VergeOS Version: 4.13

Preferred Tier Usage

How Preferred Tier Settings Determine Which Tier to Use

When creating or modifying a virtual machine (VM) disk drive in VergeOS, users can set a Preferred Tier. In most cases, this is left at default, which can be configured under System > System Settings > Default VM Drive Tier. However, the system's behavior when a specified tier does not exist can be unexpected. Here's how VergeOS determines which tier to use in such cases:

  • Setting a preferred tier to a non-existent higher tier:

    • Example: If a user selects Tier 3 in a system that only has Tier 1 and Tier 4 storage available, the system will attempt to pick the next higher (slower) tier. In this case, the system will default to Tier 4.
  • Setting a preferred tier to a non-existent lower tier:

    • Example: If a user selects Tier 3 in a system that only has Tier 1 and Tier 2 storage, the system will pick the next lower (faster) tier. In this case, the system will default to Tier 2.

In both scenarios, VergeOS ensures that the closest available tier is selected based on the user’s preference.


Document Information

  • Last Updated: 2024-08-29
  • vergeOS Version: 4.12.6

vSAN Encryption Information

You can confirm that the vSAN has encryption enabled by navigating to Nodes> Node 1> Drives and then double-clicking on the first drive in the list.  The Encrypted checkbox is checked if the Vsan is encrypted.

  • Encryption for the vSAN is configured during the initial installation only.

  • System startup on an encrypted system can be configured two different ways:

  1. The most common method is by having encryption keys written to a USB drive during the initial installation. In this scenario, these drives are typically plugged into the first two nodes of an encrypted system to boot normally. All other nodes do not require them, as Node 1 and Node 2 are the controller nodes. The USB drive does not require much storage at all, less than 1GB.
  2. If the controller nodes do not have USB encryption keys connected, the system will prompt an operator to type the proper encryption password to complete the power-up process.
  • Default encryption is set for all snapshot synchronizations through a site-sync.

Information about encrypting a Site Synchronization can be found in the Product Guide


Document Information

  • Last Updated: 2024-09-03
  • VergeOS Version: 4.12.6

Reasons for Unexpected / Unexplained vSAN Growth

There are several reasons for the vSAN to start growing at a rate faster than anticipated. Administrators should first determine when the unexplained growth occurred by reviewing the vSAN Tiers' growth history, and then assess potential areas for unexpected growth.

Review vSAN Tiers for Growth History

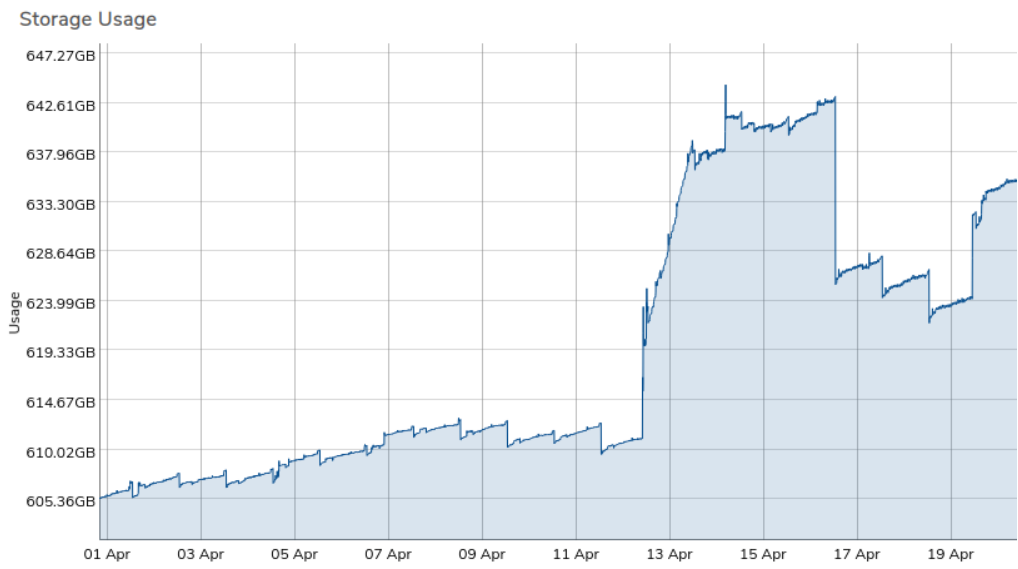
To isolate unexplained growth, it is important to narrow down when the growth increased exponentially. Using the steps below, administrators can review storage growth and visualize normal growth from daily operations versus spikes in growth, which are typically unexpected.

  1. Navigate to the vSAN Tiers from the Main Dashboard. If vSAN Tiers is not present, then this environment is a tenant of a parent system, and the vSAN tier needs to be examined at the parent system.
  2. Open the vSAN Tier with unexpected growth (for example, vSAN Tier 0).
  3. On the left navigation menu, click on History.
  4. A new menu will appear showing history in various graphs. Modify the filter period to isolate any growth on this tier. - It is recommended to start with a custom filter of 1 day and review the Storage Usage graph.

Things to Note:

  • If you see dips and spikes every hour or once a day, this is likely the result of snapshots falling out of retention (old ones expiring, new ones being created). Note whether the total storage consumed at the start of the day is nearly equivalent to the end of the day. If so, expand the custom filter to a week.
  • When reviewing by week, check if the total storage consumed at the start of the week is similar to the end. If, for example, the growth is roughly 10%, repeat for the previous week. If the weekly growth percentage is consistent, this represents your average weekly growth rate, which can help plan for hardware expansion.
  • Filter the current month and check for any sudden spikes in storage consumption on the Storage Usage graph. Click and drag over the time in question to zoom in on the data, and hover over the graph for specific date/time information.

vsan_unexpected_growth.png

Possible Reasons for Storage Increase

Several areas in the VergeOS platform may contribute to unexpected storage growth. Common areas to check include:

  • Cloud Snapshots:
  • Navigate to System > Cloud Snapshots.
  • Are any being held past their expected expiration time?
  • Are there snapshots without a Snapshot Profile? These may have been taken manually. Investigate when and why they were taken.
  • Are any snapshots set to "Never Expire"? This can lead to large data consumption over time.

  • Virtual Machines (VMs) Snapshots:

  • Navigate to the Machines Dashboard. The Snapshots count box shows the number of machine-level snapshots present. Click this box to list all VM snapshots and their creation date/time. Review if any can be removed.
  • Navigate to Machines > Virtual Machines. Sort by the Snapshot Profile column to identify VMs with machine-level snapshots. These are included in the recurring cloud snapshots, so review whether individual snapshots are necessary or if they can be removed.

  • VMWare Backup Jobs:

  • Navigate to Backup/DR > VMware Services and review each VMware Service instance for Backup Job history.
  • On the left menu, click Backup Jobs to review each specific instance. Check the Expires column for each backup and review if it can be removed.

  • Media Images:

  • Navigate to Media Images and sort by Modified. Check if any upload dates/times match the unexplained growth period.
  • Review whether media images, especially other hypervisor formats (e.g., .ova or .vhdx), can be removed.

  • Incoming Site Syncs:

  • Navigate to Backup/DR > Incoming Syncs. Open each Incoming Sync dashboard and check the Received Snapshots count. Investigate the source (origin) site for increased storage matching the timeframe.

  • Tenant Storage:

  • Navigate to Tenants > Each Tenant Dashboard.
  • Review Total Storage Used by clicking on History in the left menu. Follow the same process listed above to review growth history.
  • If unexpected growth is found, investigate within the tenant for the possible causes of storage increase (as listed above), and within any sub-tenants if applicable.

Document Information

  • Last Updated: 2024-09-03
  • VergeOS Version: 4.12.6

How To Identify a Failed Disk In Your VergeOS Environment

VergeOS offers a diagnostic function that allows system administrators to turn a disk drive's LED light on or off, making it easier to physically identify a failed or problematic drive. Follow the steps below to locate a failed disk drive for replacement.

Steps to Identify a Failed Disk

  1. Log in to the VergeOS UI and navigate to the dashboard of the node where the failed disk resides.
  2. On the Node Dashboard, locate and select Diagnostics from the left-hand column.
  3. In the Diagnostics page, change the Query to LED Control (Drive).
  4. In the LED Control (Drive) details section:
    • Path: Enter the path to the drive you want to locate (e.g., /dev/sdb). If you're unsure of the path, check the system alerts and logs for recent error or warning messages.
    • State: Set the LED state to On, then click Send to activate the LED light on the drive.
  5. Locate the drive with the active LED indicator in your physical server.
  6. Once the drive has been identified and replaced, set the State to Off and click Send to deactivate the LED light.

For detailed instructions on drive replacement, refer to the Maintenance section in the inline help under Drive Replacement. This section guides you through the entire process.


Document Information

  • Last Updated: 2024-08-29
  • vergeOS Version: 4.12.6