Removing a Node from a VergeOS Cluster
Overview
This guide covers the process of removing a physical node from a VergeOS system. This procedure is used for hardware decommissioning, cluster downsizing, or node replacement scenarios.
Important Limitation
Node removal can only be performed on the last node in the system. Nodes must be removed in reverse order (last added, first removed).
Prerequisites
Before removing a node, ensure the following:
- vSAN Health: All vSAN tiers must be healthy (green status)
- Cluster Size: At least two nodes must remain in the cluster after removal
- Recent Snapshot: A current system snapshot is recommended before proceeding
- Backup Access: Verify IPMI or console access is available for troubleshooting
Removal Process
Step 1: Enable Maintenance Mode
- Navigate to System > Nodes.
- Double-click the last node in the system.
- Click Enable Maintenance on the left menu.
- Click Yes to confirm.
- Wait for all workloads to migrate off the node. Monitor the Running Machines section until it is empty.
Non-Migratable Workloads
VMs with GPU passthrough or host CPU type must be powered off manually before the node can enter maintenance mode.
Step 2: Offline and Delete Drives
Before powering off the node, all drives must be removed from the vSAN.
- From the node's dashboard, click Drives on the left menu.
- Select all drives listed for the node.
- Click Offline from the action menu.
- Click Yes to confirm.
- Wait for all drives to show Offline status.
- With all drives still selected, click Delete from the action menu.
- Click Yes to confirm the deletion.
Wait for Data Migration
After deleting the drives, the vSAN will migrate data to remaining drives. Monitor the vSAN dashboard and wait for repairs to complete before proceeding to the next step.
Step 3: Power Off the Node
Verify vSAN Health Before Proceeding
Before powering off the node, navigate to Infrastructure > vSAN Tiers and confirm all tiers are green (healthy). Do not proceed until the vSAN has fully recovered from the drive removal in Step 2.
- Once all drives are deleted and the node status shows Maintenance Mode, click Power Off on the left menu.
- Click Yes to confirm.
- Wait for the node to fully power down.
Step 4: Delete the Node
- With the node powered off, click Delete on the left menu.
- Click Yes to confirm the deletion.
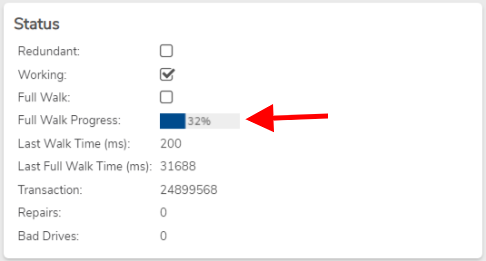
Step 5: Wait for Final Repairs
After the node is deleted, the vSAN will perform final data redistribution across the remaining nodes.
- Navigate to System > vSAN to monitor repair progress.
- Wait for all tiers to return to green (healthy) status before performing any other operations.
Do Not Interrupt Repairs
Do not power off, restart, or remove additional nodes while vSAN repairs are in progress. Allow the repairs to complete fully.
Post-Removal Verification
After repairs complete:
- Verify all vSAN tiers show green status
- Confirm cluster resources are balanced across remaining nodes
- Check system logs for any warnings or errors